

A Look at American Household Debt
And what it means for the economy


Americans continue to accumulate debt, but the types of debt and the repayment terms of said debt vary significantly, which has far-reaching implications for our economy.
The debt story is not all bad, however. In fact, Americans’ current collective debt-to-income ratio is much lower than it was in 2008 when the economy cratered. As shown in the chart below, as of the third quarter of 2024, which is the most recent quarter for which data is available, Americans’ debt payments were running at about 11.3% of incomes. In 2008, this number peaked at nearly 16%, a reflection of both a large amount of loans at the time (the numerator in the equation) and lower incomes as a result of job losses (the denominator):
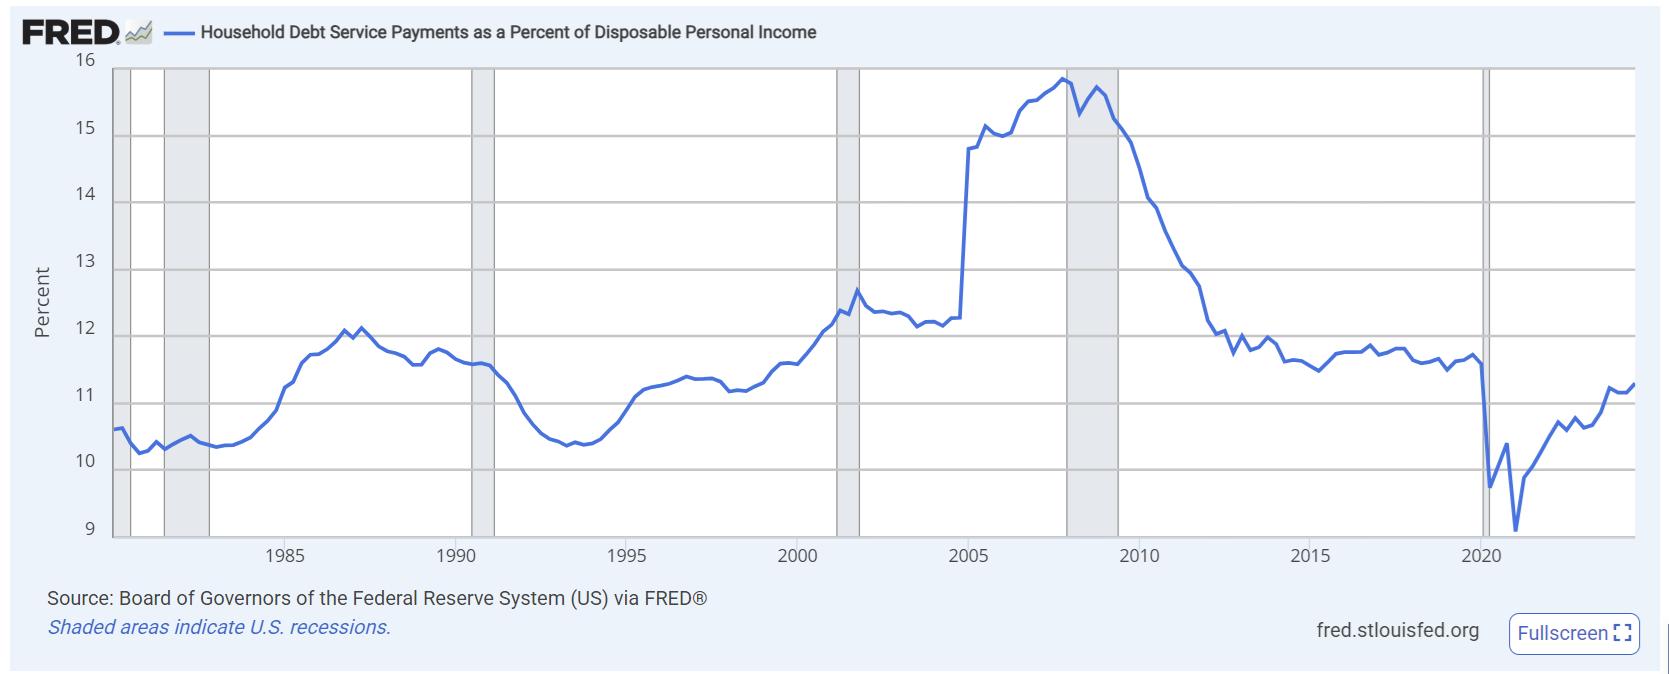
The debt-to-income ratio is more in line today with historical numbers from the 1980s and 1990s. It is worth tracking this statistic however, as the trajectory over the past four years is definitely in a worsening direction. The worrisome thing about that is that the unemployment rate has been very low during this time, and although inflation has been a major topic of concern and put a crunch on household budgets, wages have, in fact, outpaced inflation the last couple of years (although only modestly so). All that being said, debt levels are rising, in part, because interest rates have gone up, which means higher payments even for the same levels of debt.
One particularly positive area in the debt picture is in home mortgages. As of last year, nearly 40% of American homeowners have paid off their homes entirely, resulting in no mortgage debt at all. Homeowners with pre-2023 mortgages also typically enjoy historically low mortgage rates, many of them locked in for 30 years.
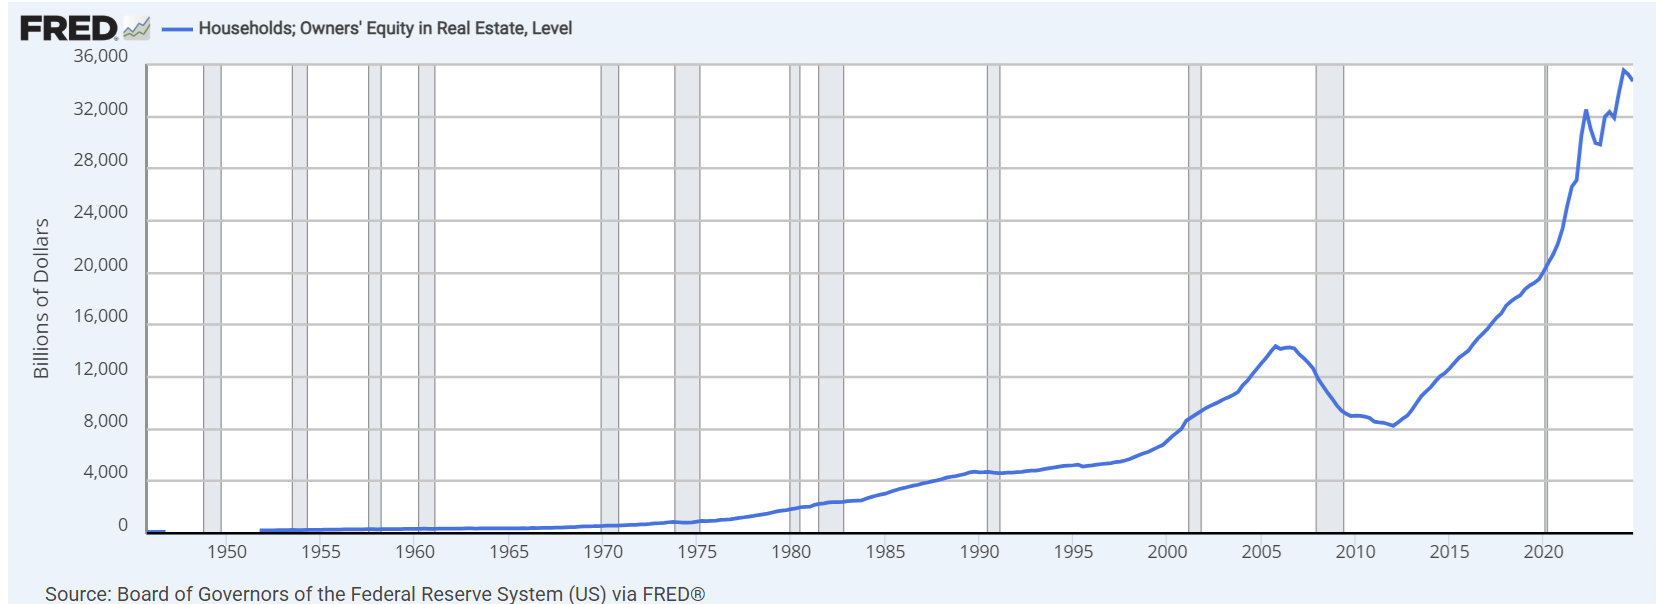
The story on mortgage debt reflects a homeowner base that is in remarkably good shape. I wrote about this a few years ago in a 2007 vs. 2021 article, when I argued we were not at the cusp of a housing bubble or housing market crash despite a rapid run-up in prices. The story remains true today. Rather than be overleveraged and struggling with ever-escalating variable rates (as was often the case in 2008), Americans today collectively have a record high amount of equity in their homes. This is an attractive mathematical reality, attributed to both notable mortgage paydowns (including paid off mortgages altogether) and rising property values.
The chart below shows the trajectory of homeowner equity in homes, with skyrocketing improvements clearly evident since 2010. This is not an indicator of a housing market that is about to collapse:
The one unfortunate piece of the story on home mortgage debt, however, is that an entire generation coming into the start of their home-buying years remains virtually excluded from much of this, plagued by high prices, high interest rates, and tight underwriting standards by banks for home loans for new borrowers. I’ve written about this extensively in the past and will come back to it again, so I’ll leave that item there for now. But frustrations abound for those just getting started out.
Credit Cards
The credit card story is where alarm bells start ringing. Credit card balances and credit card interest rates are both at historical highs. The top chart below shows Americans’ overall credit card balances, which total nearly $1.1 trillion. The bottom chart shows the average credit card interest rate, which peaked at 21.76% in August 2024, and was down marginally to 21.47% in November 2024, the most recent reading for which data was available, but still basically at all-time highs:
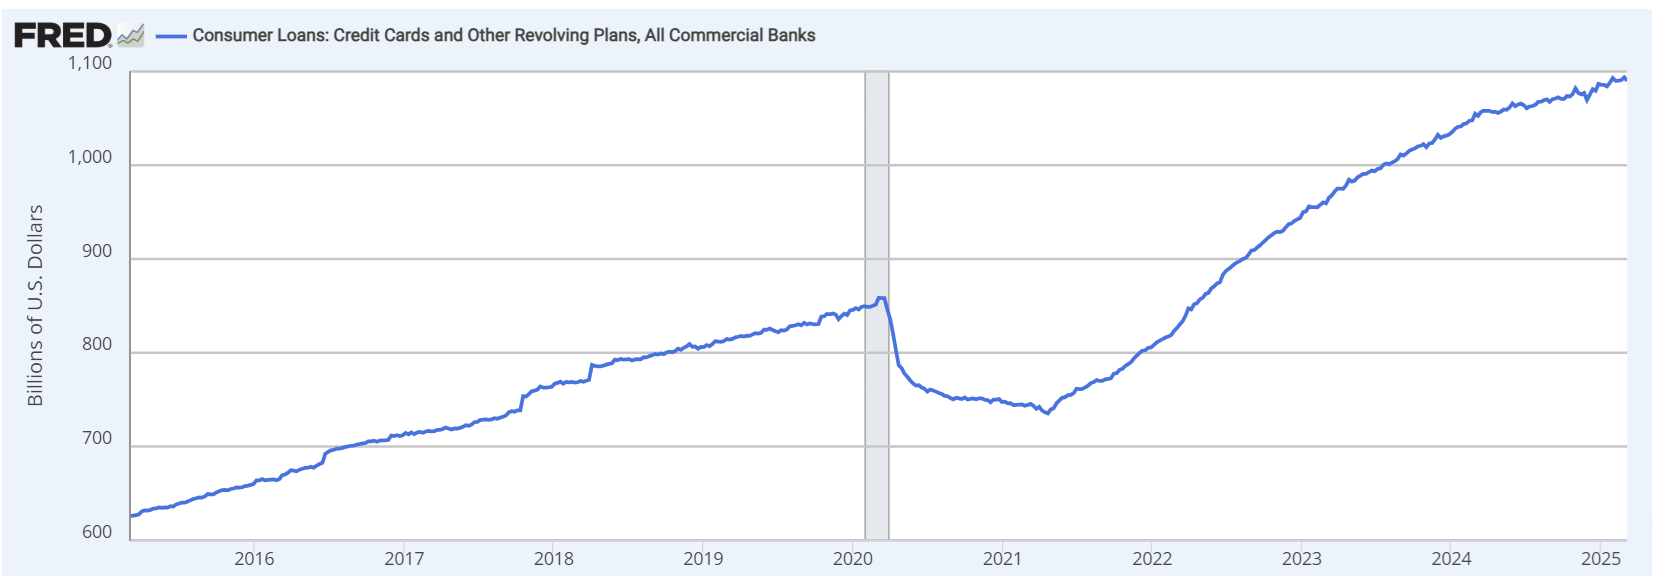
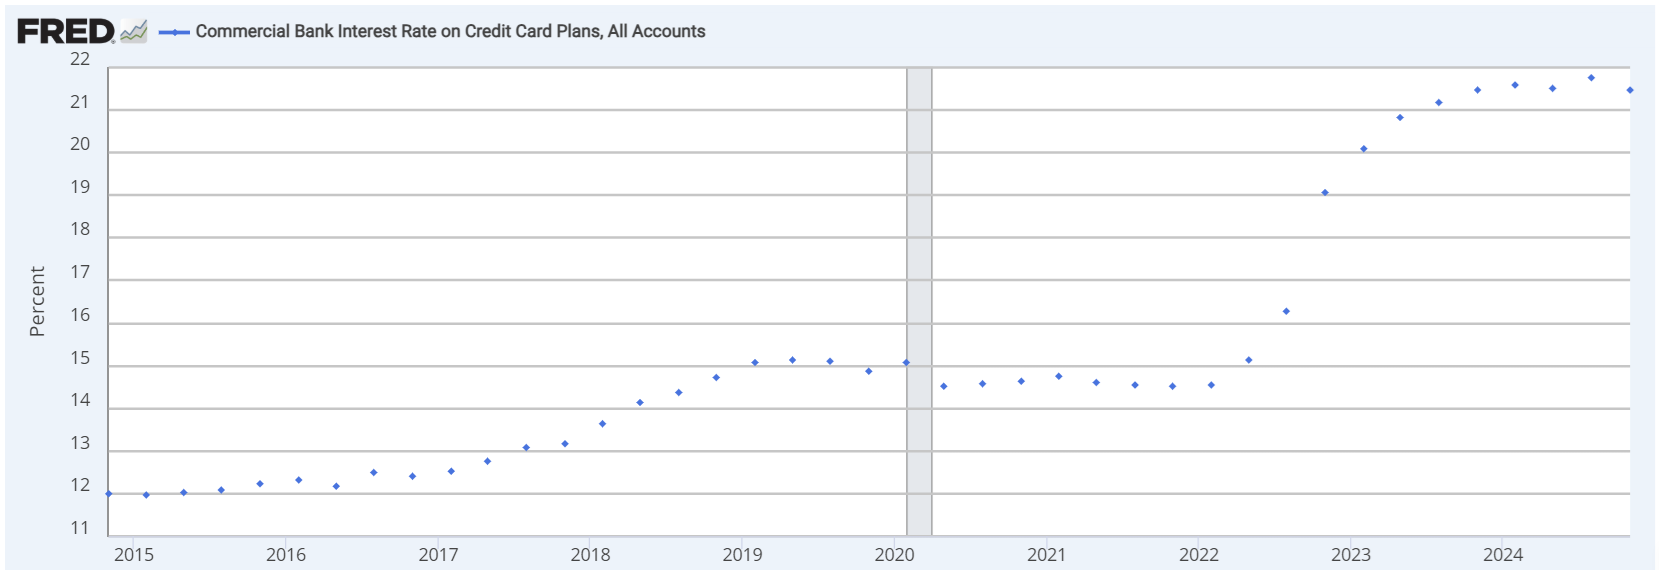
What a challenging combination — record high balances and record high rates, both problematic for the obvious reasons.
Most credit cards require a minimum monthly payment of 2-3% of the overall balance. In recent months, the percentage of American credit card holders making only the minimum payment has increased to a 12-year high.
For an economy that depends on consumer spending, this is a precarious place to be. Debt is not inherently bad—it fuels growth, investment, and opportunity. But when debt becomes unmanageable, when more people fall behind, the economy shifts. Right now, we’re at an inflection point. If trends continue—rising credit card delinquencies, declining consumer sentiment—the weight of our debt may start feeling a lot heavier.
Can consumers keep propping things up? The challenge, as always, is that the U.S. economy runs on consumption. When people start pulling back, businesses feel it, and the cycle turns.
What Comes Next
Home loan applications including for HELOCs are at record-low levels. Consumer loan applications (i.e. cars, personal loans, etc.) remain moderate, although a bit on the low side too. Credit card borrowing remains high. This is not a great combination for the good of the economy.
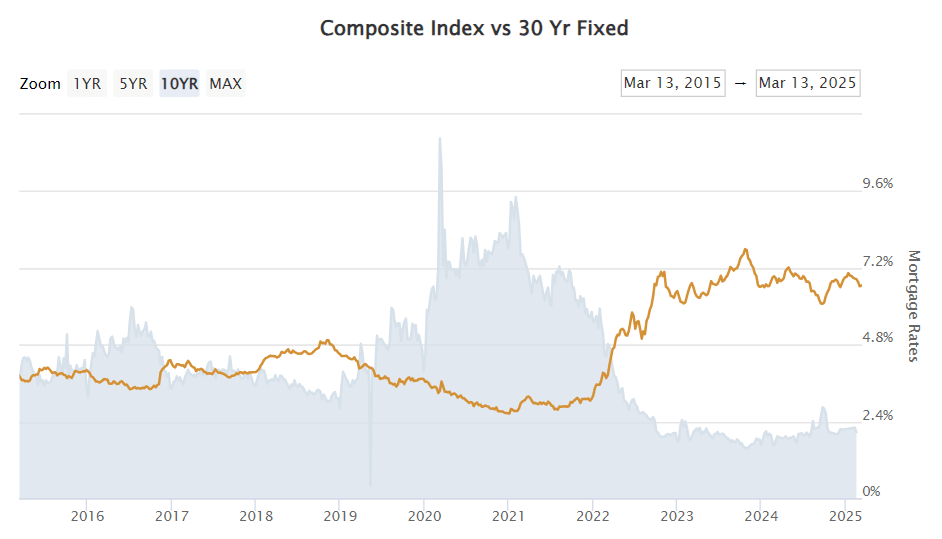
Possible ways through this are if interest rates fall. A decline in rates would spur increases in the “good type” of borrowing, by which I mean longer-term and better collateralized debt with lower interest rates. The chart below via Mortgage News Daily shows the correlation between the mortgage loan application composite index (blue shared area) and the average 30-year fixed interest rate (orange line). You can see how when rates declined from 2019-2022, mortgage application activity increased. And then when rates rose from 2022-2024, mortgage applications declined.
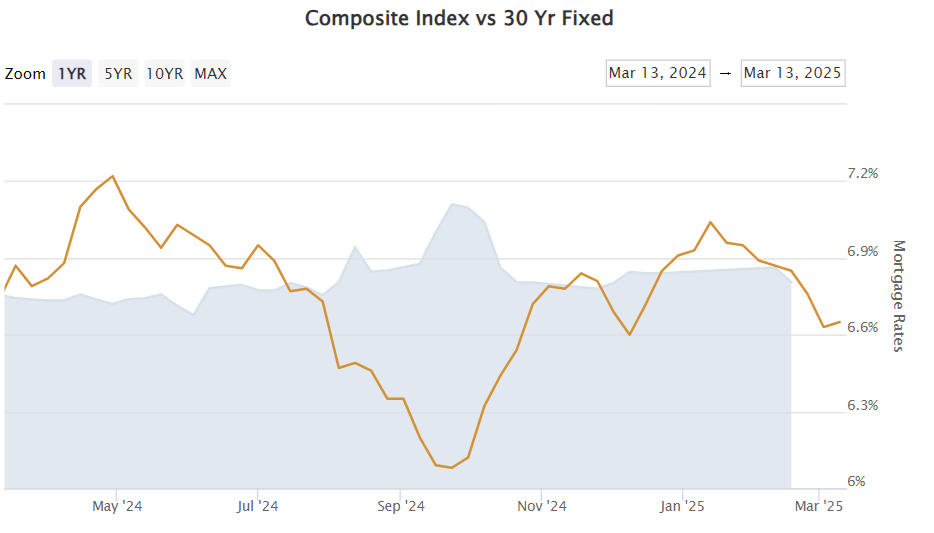
The chart below shows the same data as above, only zoomed in on just the last year. You can really see how rate-sensitive the homebuyer pool is these days: the jog higher in rates last September and October resulted in almost a nearly perfect inversely correlated decline in mortgage applications. In other words, when rates went up, mortgage applications went down, virtually in real time. When rates dropped back down modestly, home loan applications went back up:
I will come back in future weeks to the question of when interest rates are likely to decline in a meaningful way. The conventional wisdom in the banking world last year was that rates would drop by a quarter point just about every quarter of the year in 2025. The brakes have been pumped on that, however, and now the phrasing many banks are using is “higher for longer.” Time will tell. It’s a complicated question in that for rates to decline, we may need to see more weakness in the economy (i.e. a rise in the unemployment rate, declines in GDP and consumer spending, etc.). The possible improvement in rates is therefore wrapped up in something bad — economic deterioration — which is no easy thing for policymakers and others to navigate, especially in such an emotionally charged and politically fraught world.
Ben Sprague lives and works in Bangor, Maine as a Senior V.P./Commercial Lending Officer for Damariscotta-based First National Bank. He previously worked as an investment advisor and graduated from Harvard University in 2006. Ben can be reached at ben.sprague@thefirst.com or bsprague1@gmail.com.
Have a great week, everybody!
Thanks for another highly informed analysis.
I have a couple of questions that you be able to assist with.
A card interest rate that is in excess of 20% looks punitive to me. Is this made necessary by a high rate of defaults.
Secondly, what is the range of merchant fees charged on transactions and who provides the best rates?
Which organizations provide the most competitive service from the card holders point of view?
What proportion of card holders are maxed out on their credit cards and is this changing over time?
Ben, Thanks for your concise information. Since I am part of the economy without wages, wages keeping up with inflation is irrelevant for me. What percent of the population is retired or of working age but without a job or even looking for a job? Thanks.